- 20 Aug, 2026
What Is eCPM and Why Does It Matter?
Your dashboard shows a $10 CPM. You feel good. Then your revenue report arrives, and the numbers do not match your expectations. What happened?
You were looking at the wrong number.
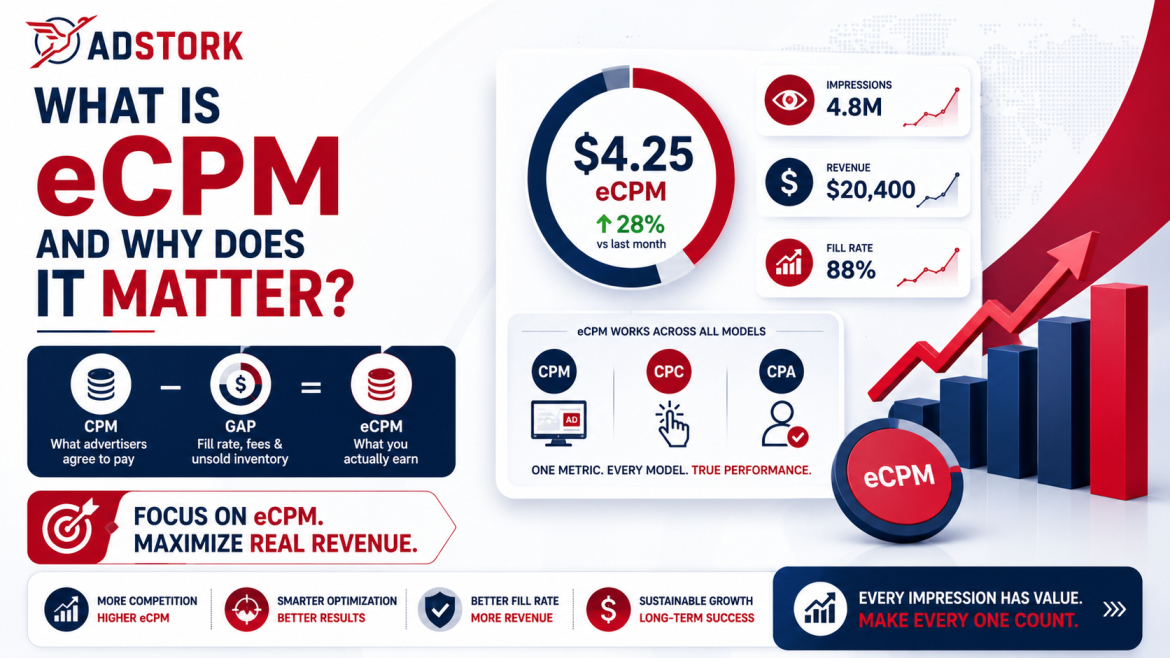
CPM tells you what an advertiser agrees to pay. eCPM tells you what you actually earn. The gap between these two numbers reveals everything about your monetisation health—fill rate gaps, revenue share leaks, and demand partner performance. Publishers who track eCPM instead of CPM make smarter decisions, capture more revenue, and build more sustainable businesses.
This guide explains what eCPM is, how to calculate it, why it matters more than CPM, and actionable strategies to improve yours in 2026.
Key Takeaways
- eCPM (effective cost per mille) is your actual revenue per 1,000 impressions—calculated as (Total Revenue ÷ Total Impressions) × 1,000.
- CPM is what advertisers pay; eCPM is what publishers earn. The gap reveals fill rate issues, revenue share, and unsold inventory.
- A $1.00 eCPM increase can drive 25-40% annual revenue growth without additional traffic.
- Good display eCPM in 2026: $3–$8 for US desktop, $1.50–$5 for US mobile.
- eCPM works across all pricing models—CPM, CPC, and CPA—giving you one number to compare everything.
What Is eCPM?
eCPM stands for effective cost per mille. "Mille" is Latin for thousand, so eCPM measures your effective revenue per 1,000 ad impressions. It is a publisher-side metric that calculates how much money you actually earn for every thousand times an ad is served on your site.
The key word is "effective." Unlike CPM, which is a negotiated rate between an advertiser and a publisher, eCPM reflects what you actually take home after everything that happens in the auction—fill rate, revenue share, unsold inventory, and the performance of different pricing models.
eCPM is not limited to CPM campaigns. It works across every pricing model—CPC (cost per click), CPA (cost per acquisition), and CPM. This makes it the only metric that lets you compare performance across different ad types, demand partners, and pricing structures on equal terms.
Neuromarketing insight: the human brain fixates on the number that looks best—the high CPM. But that number is a promise, not a reality. eCPM forces you to confront what you actually earn. This shift from "what could be" to "what is" changes how you optimise. Publishers who embrace this reality consistently outperform those who chase vanity metrics.
The eCPM Formula
The calculation is straightforward:
eCPM = (Total Ad Revenue ÷ Total Impressions) × 1,000
Example 1: Basic Calculation
Your site earned $450 from 200,000 impressions yesterday.
eCPM = ($450 ÷ 200,000) × 1,000 = $2.25
You earned $2.25 for every 1,000 impressions served.
Example 2: Comparing Two Ad Units
Your sidebar 300x250 earned $180 from 80,000 impressions. Your in-content 728x90 earned $120 from 90,000 impressions.
Sidebar eCPM: ($180 ÷ 80,000) × 1,000 = $2.25
In-content eCPM: ($120 ÷ 90,000) × 1,000 = $1.33
The sidebar unit outperforms the in-content unit by 69%. This tells you to investigate why—is the sidebar more viewable? Does it attract better demand?
eCPM vs. CPM: The Difference That Matters
The distinction between eCPM and CPM is the single most important metric difference for publishers to understand.
CPM (cost per mille) is an advertiser-side metric. It is the price an advertiser agrees to pay for 1,000 impressions of their ad. When a brand says "we are running a $10 CPM campaign," they mean they will pay $10 for every thousand times their ad is shown. CPM is a planning and budgeting unit for advertisers.
eCPM (effective cost per mille) is a publisher-side metric. It is the revenue you actually earn per 1,000 impressions served—across all impressions, including the ones that did not fill, the ones that cleared at lower prices, and the ones where revenue share was applied.
The gap between CPM and eCPM tells a story. If your CPM is $10 but your eCPM is $4, you are losing $6 per 1,000 impressions to fill gaps, revenue share, or auction dynamics. That gap is your opportunity.
Here is a real-world example: Publisher A runs a campaign with a $10 CPM but only fills 40% of ad requests. Publisher B runs a $5 CPM campaign with a 90% fill rate. Publisher A earns $4 eCPM ($10 × 40%). Publisher B earns $4.50 eCPM ($5 × 90%). The lower CPM generates more revenue. eCPM makes this discrepancy visible immediately.
eCPM vs. RPM: Another Important Distinction
RPM (revenue per mille) is often confused with eCPM. The distinction is subtle but important.
eCPM measures revenue per 1,000 ad impressions served. It is an impression-level metric.
RPM measures revenue per 1,000 page views or sessions. It accounts for fill rate, ad density, and everything else that happens between a user visiting your site and an ad successfully loading.
Two publishers can have identical eCPMs but very different RPMs if one runs three ads per page and the other runs one. RPM captures how your monetisation setup performs for real users in real sessions. RPM is better for business planning and revenue forecasting. eCPM is better for comparing ad units, demand partners, and auction performance.
Industry Insight: eCPM Benchmarks and Trends in 2026
What is a good eCPM in 2026? The answer depends on your geography, format, and audience quality. But here are the benchmarks that matter.
Display eCPM benchmarks (2026):
• US desktop traffic: $3 – $8
• US mobile traffic: $1.50 – $5
• Top-tier financial/crypto publishers: $8 – $15+ display, $20 – $30+ video
• UK programmatic average (Q1 2026): £1.30
Ad format differences: Video ads typically command $10–$25 eCPM, compared to $1–$3 for standard display. Rewarded video has stabilised in the high single digits to low double digits globally, with premium markets consistently outperforming.
Geographic differences: The United States, United Kingdom, Australia, Canada, and Western Europe consistently deliver the highest eCPMs across all formats. A good eCPM for US traffic may vary from $5 to $10, while $0.50 may be good enough for India.
2026 trends: The ad supply crunch is reshaping eCPM. In June 2026, ad supply fell roughly 40% year on year across the UK and US. UK eCPMs rose around 30%, while US eCPMs rose about 7%. Publishers who package and signal their inventory clearly are capturing this value.
Tracking eCPM is only half the battle—improving it requires the right infrastructure. Adstork connects publishers to multiple premium demand sources through a unified header bidding platform, driving real-time competition that consistently lifts eCPM. Publishers on multi-SSP setups typically see 20-40% eCPM uplifts compared to single-source or waterfall configurations. Explore Adstork's publisher solutions and see how better demand competition can transform your eCPM.
Why eCPM Is the Most Important Publisher Metric
eCPM matters because it gives you one number that captures your entire monetisation performance. Here is why it is the metric you should track above all others.
It normalises across pricing models. Without eCPM, you cannot compare a CPC campaign against a CPM campaign. With eCPM, you can. If Partner A pays $4 CPM, Partner B pays $0.25 CPC with 0.8% CTR, and Partner C pays $5 CPA with 0.3% conversion rate, eCPM reveals Partner A as the winner at $4.00, Partner B at $2.00, and Partner C at $1.50.
It reveals fill rate problems. A high CPM with low fill generates less revenue than a moderate CPM with high fill. eCPM captures this trade-off immediately.
It enables accurate partner evaluation. eCPM lets you compare SSP A against SSP B on equal terms, regardless of their pricing models.
It drives revenue growth. According to industry observations, publishers who increase eCPM by $1.00 while maintaining fill rate often see 25-40% yearly revenue growth—not from more traffic, but from better monetisation.
Comparison Table: CPM vs. eCPM vs. RPM
Understanding the differences between these three metrics is essential for making informed decisions about your monetisation strategy.
| Metric | Who Uses It | What It Measures | Formula |
|---|---|---|---|
| CPM | Advertisers | Price paid per 1,000 impressions | Negotiated rate |
| eCPM | Publishers (slot-level) | Actual revenue per 1,000 impressions served | (Revenue ÷ Impressions) × 1,000 |
| RPM | Publishers (site-level) | Revenue per 1,000 page views or sessions | (Revenue ÷ Pageviews) × 1,000 |
How to Improve Your eCPM
Improving eCPM is about capturing more value from your existing traffic. Here are the most effective strategies in 2026.
1. Implement header bidding. Header bidding creates real-time competition among multiple SSPs for every impression. Publishers on multi-SSP header bidding platforms have achieved 20-40% eCPM uplifts compared to single-source or waterfall setups.
2. Use dynamic floor pricing. Static floor prices can erode CPMs by 20-30% across device and geo segments. Dynamic floors, adjusted via real-time yield data, balance fill rates and eCPM to capture 15%+ RPM uplift without traffic growth.
3. Optimise viewability. Higher viewability attracts better demand. Above 80% viewability, buyers stop differentiating on viewability scores and start differentiating on fill rate, inventory volume, and audience quality.
4. Diversify demand sources. Better demand leads to higher bids. More competition leads to better auctions. Better user experience leads to better performance. In 2026, the gap between average and high-performing inventory is widening.
5. Optimise Core Web Vitals. Publishers who systematically optimise Core Web Vitals alongside header bidding and floor pricing consistently see 20-40% yield improvements.
6. Use higher-value formats. Video ads typically command $10-$25 eCPM compared to $1-$3 for display. Native ads can have 200% higher CPMs than standard banner ads.
Future Outlook: eCPM in 2026 and Beyond
Several trends are shaping the future of eCPM for publishers.
AI-powered pricing intelligence is giving publishers a new advantage. When implemented correctly, AI-driven floors maximise the multiplication of CPM and fill rate rather than optimising either in isolation.
Privacy regulations are creating eCPM differentials. With Apple ATT and Android Privacy Sandbox, unconsented traffic can earn 20-40% lower eCPMs due to limited targeting signals. Apps that implement clear value-exchange consent flows see 15-35% eCPM uplift.
Supply scarcity is driving eCPM growth. As ad supply declines and audiences fragment, the price per impression is holding or rising. Publishers who package and signal their inventory clearly will capture this value.
Attention-based metrics are emerging. Publishers are shifting from optimising for fill rate to optimising for attention. Fewer ads, better placements, and stronger outcomes are driving yield growth without adding more ads.
eCPM is not just another acronym. It is the single most important metric for understanding your actual ad revenue performance. CPM tells you what could be. eCPM tells you what is. The publishers who track eCPM, optimise for it, and build their monetisation strategy around it consistently outperform those who chase vanity metrics.
If you are ready to move beyond CPM and start optimising for what you actually earn, Adstork provides the infrastructure you need. Our unified platform connects you to multiple premium demand sources, delivers transparent reporting that shows your true eCPM across every placement, and helps you identify exactly where you are leaving revenue on the table. Sign up for a free Adstork publisher account and get a complimentary eCPM audit that shows you where your biggest opportunities are.
Your immediate action plan: Pull your last 30 days of reporting and calculate your eCPM for each ad unit, demand partner, and placement. Compare your eCPM against industry benchmarks. Identify your lowest-performing segments and investigate why—is it fill rate, viewability, or demand quality? Test one improvement (like adding a header bidding partner or adjusting floor prices) and measure the impact on eCPM over two weeks. Share your results with Adstork's optimisation team for a personalised improvement plan.
FAQs
What is eCPM in simple terms? eCPM (effective cost per mille) is the revenue a publisher actually earns for every 1,000 ad impressions. It is calculated as (Total Revenue ÷ Total Impressions) × 1,000.
What is the difference between eCPM and CPM? CPM is what an advertiser agrees to pay per 1,000 impressions. eCPM is what a publisher actually earns per 1,000 impressions after accounting for fill rate, revenue share, and unsold inventory.
What is a good eCPM for publishers in 2026? A good display eCPM is $3–$8 for US desktop traffic and $1.50–$5 for US mobile traffic. Premium financial and crypto publishers can achieve $8–$15+ for display and $20–$30+ for video.
How do I calculate eCPM? Use the formula: eCPM = (Total Ad Revenue ÷ Total Impressions) × 1,000. For example, if you earned $450 from 200,000 impressions, your eCPM is $2.25.
Why does eCPM matter more than CPM for publishers? eCPM captures your actual earnings across all pricing models and fill rates. CPM only shows what an advertiser agrees to pay. A high CPM with low fill often earns less than a moderate CPM with high fill. eCPM reveals this discrepancy immediately.
What factors affect eCPM? eCPM is affected by geography (premium markets like US, UK, Australia deliver higher eCPMs), ad format (video and native outperform display), device (desktop vs. mobile), viewability, fill rate, demand partner quality, and user engagement.
How can I increase my eCPM? Implement header bidding to create competition, use dynamic floor pricing, optimise viewability, diversify demand sources, improve Core Web Vitals, and use higher-value formats like video and native.
Comments (0)
Latest Blog

What Is Publisher Fill Rate?
18 Aug, 2026
Leave a Comment