- 18 Aug, 2026
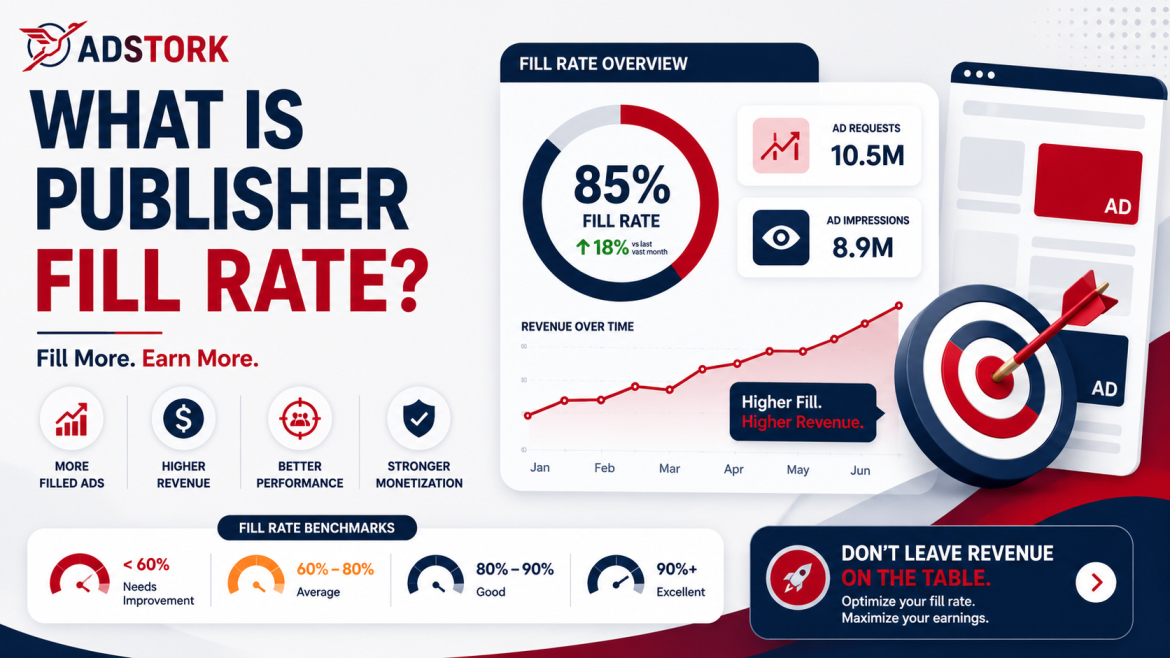
What Is Publisher Fill Rate?
Your traffic is strong. Your content is solid. Your CPM looks respectable. So why does your revenue feel like it is stuck in neutral?
The answer might be hiding in a metric most publishers overlook: fill rate.
Picture your website as a digital billboard with spaces available for advertisements. Each space represents an opportunity to earn money. The fill rate tells you what percentage of those available spaces are actually filled with an ad that visitors can see. If you are running at 70% fill, that means 30% of your inventory is generating zero revenue. Every unfilled ad request is a missed opportunity.
This guide breaks down everything you need to know about publisher fill rate: what it is, how to calculate it, why it matters more than you think, and actionable strategies to improve yours in 2026.
Key Takeaways
- Fill rate is the percentage of ad requests that successfully display an ad—think of it as your conversion rate for ad inventory.
- Publishers at 90%+ fill earn 5.3x more revenue per session than those below 40%.
- Most publishers achieve between 80% and 90% fill; below 80% means you are leaving significant revenue on the table.
- Fill rate and CPM work together—chasing high CPM while ignoring fill rate often reduces total revenue.
- Header bidding with multiple SSP partners typically achieves 85-95% fill rates vs. 40-70% for single-source setups.
What Is Publisher Fill Rate?
Publisher fill rate is the percentage of ad requests that successfully result in an ad being displayed on your website or app. It is one of the simplest and most important indicators of whether your ad inventory is being effectively monetized.
To understand fill rate, you need to understand the two components: ad requests and ad impressions.
Ad request: Every time a page loads on your site, your ad server asks ad networks, exchanges, and SSPs for an ad to display. That is an ad request.
Ad impression: When an ad actually loads and displays in that space, that is an ad impression.
The fill rate shows how many of those requests were actually filled. A higher fill rate means more of your available ad inventory is being monetized. A lower fill rate indicates unfilled ad space and potential revenue loss.
Neuromarketing insight: publishers instinctively focus on the number that feels like progress—CPM. But the brain fixates on the highest visible number while ignoring the silent revenue leak of unfilled impressions. This is salience bias. The publishers who break this habit and track fill rate alongside CPM consistently outperform those who chase CPM alone.
How to Calculate Fill Rate (With Example)
The formula is straightforward:
Fill Rate (%) = (Number of Ad Impressions ÷ Number of Ad Requests) × 100
Example: If your website sends 1,000 ad requests and ads are served for 850 of those requests, your fill rate is:
(850 ÷ 1,000) × 100 = 85%
This applies across all ad formats—display, video, native, and in-app—and serves as your early warning system for revenue leaks.
But here is where it gets interesting. According to Playwire's 2026 State of Ad Revenue Report, the correlation between fill rate and revenue per session at the individual publisher level is only 0.12. That sounds weak. But segment by fill bracket, and the picture changes completely.
Publishers consistently hitting 90%+ fill earn 5.3x more revenue per session than those stuck below 40%. The step from under 40% fill to 40-60% fill alone is a 2.5x RPS lift.
Why Fill Rate Matters More Than You Think
Fill rate matters because empty ad slots generate zero income, period. Every unfilled ad request represents inventory that could have generated income but did not.
Here is the math: if a publisher serves 25 million ad requests per month and operates at a 75% fill rate, 6.25 million impressions remain unfilled. At a $3 eCPM, that translates to approximately $18,750 in lost revenue per month, or more than $225,000 annually, solely due to unfilled inventory.
Yet many publishers still accept a 70% to 80% fill as normal. The industry average on open exchanges ranges from 70-90% for premium publishers and 40-70% for long-tail inventory. But top performers consistently achieve 85-95% using header bidding with multiple SSP partners.
The gap between 70% and 90% fill on 10 million monthly ad requests at a $3 CPM is $60,000 per year. That is revenue that requires zero additional traffic, content, or marketing spend.
As Tiberiu Stingaciu, Head of Business Development at Sevio, explains: "Unfilled impressions are one of the quietest forms of revenue loss. Publishers often focus on CPMs, but every ad request that isn't filled represents demand that never had the chance to compete. Over time, low fill rate silently erodes revenue, even on high-traffic sites."
Industry Insight: What the 2026 Data Shows
The 2026 data tells a story the industry narrative misses. Fill rate is one of the sharpest revenue levers publishers have. When publishers optimize for CPM while letting fill rate erode, they are often trading more total revenue for a more flattering per-impression number.
Geography sets your fill ceiling. Audience location determines how much advertiser demand exists for your inventory, and no amount of optimization closes that gap entirely. Publishers in emerging markets typically see 20-30% lower fill rates due to reduced demand.
Within any demand tier, three behavioral levers actually move fill rate: floor pricing calibration, viewability above 70%, and demand breadth across your bidder stack.
The floor price trap is real. Publishers with aggressive floors run at roughly half the fill rate of right-sized competitors, charge nearly 2x the CPM per impression, and still generate 18% less revenue per session.
In a survey by AdMonsters, nearly one-third of over 60 monetization experts reported fill rates above 90%, typically among publishers actively optimizing demand, pricing, formats, and performance.
Improving fill rate starts with understanding where your gaps are. Adstork provides publishers with transparent, real-time reporting that shows fill rate segmented by country, device, format, and placement. You can see exactly which segments are underperforming and make data-driven adjustments without guesswork. Explore Adstork's publisher reporting tools and start closing your fill rate gaps today.
What Is a Good Fill Rate?
There is no one-size-fits-all answer. But here are the benchmarks that matter in 2026:
90%+ (Excellent): Top-performing publishers with header bidding, multiple demand sources, and optimized floor pricing. These publishers earn 5.3x more per session than those below 40%.
80-90% (Good): Most well-optimized publishers land here. If you are below 80%, you are likely missing impressions and revenue.
70-80% (Average): Acceptable but with significant room for improvement. Open exchange single-SSP setups typically run 70-85%.
Below 60% (Concerning): Indicates structural issues with demand access, floor pricing, or targeting restrictions.
Header bidding with 5-8 SSP partners typically achieves 85-95% fill rates compared to 40-70% for single-source setups.
Comparison Table: High Fill vs. Low Fill Publishers
Here is how high-fill and low-fill publishers compare across key metrics with identical traffic volumes.
| Metric | High Fill Publisher | Low Fill Publisher |
|---|---|---|
| Monthly Ad Requests | 10,000,000 | 10,000,000 |
| Fill Rate | 90% | 70% |
| CPM | $3.00 | $3.00 |
| Monetised Impressions | 9,000,000 | 7,000,000 |
| Monthly Revenue | $27,000 | $21,000 |
| Annual Revenue Gap | — | $72,000 |
The $72,000 annual gap requires zero additional traffic, content, or marketing spend. It is entirely driven by fill rate optimization.
How to Improve Your Publisher Fill Rate
Improving fill rate is often easier and more impactful than increasing CPM. Here are the most effective strategies based on 2026 data.
1. Diversify your demand sources. Relying on a single demand partner caps your fill rate. Header bidding with 5-8 SSP partners typically achieves 85-95% fill rates vs. 40-70% for single-source setups. More competition means higher RPMs and better fill rates.
2. Calibrate floor prices strategically. The floor price trap is real. Publishers with aggressive floors run at roughly half the fill rate of right-sized competitors. Test floors granularly by GEO and device, and measure total revenue, not just CPM.
3. Improve viewability above 70%. Above 80% viewability, buyers stop differentiating on viewability scores and start differentiating on fill rate, inventory volume, and audience quality. Higher viewability attracts more demand, which improves fill rate.
4. Use multiple ad formats. Video and native ads often achieve higher fill rates than standard banners. Popular sizes like 300x250 consistently show stronger demand.
5. Optimize technical performance. Slow-loading pages mean ads do not render before users leave. Google PageSpeed Insights recommends sub-3-second load times. Ad blockers eliminate 10-20% of requests entirely.
6. Create passback tags. When your primary demand source does not fill, pass the request to a secondary source. This captures revenue that would otherwise be lost.
7. Monitor fill rate weekly. Sudden drops are leading indicators of campaign delivery issues before spend drops are visible.
Future Outlook: Fill Rate in 2026 and Beyond
The focus on fill rate is intensifying as the industry evolves. Several trends are making fill rate more important, not less.
Server-side header bidding is making it easier to add more demand partners without sacrificing page speed. Publishers can include more partners in the same auction, improving fill rates without performance penalties.
AI-driven optimization is increasingly being used to optimize fill rates in real time. These models adjust floors, route traffic to demand partners, and even predict which inventory will fill at which price.
Cookie deprecation is fragmenting demand across publishers. Some will see lower fill rates as advertisers shift budgets to cookie-resilient partners. Others will see fill rates improve as they become more attractive to advertisers who value contextual quality.
Unified measurement is moving the industry toward a single metric that captures both fill and price: effective RPM. This shift will help publishers move beyond the CPM fixation and focus on the metric that actually matters.
The publishers winning today are focusing on attention, engagement, and premium inventory instead of chasing 100% fill at any cost. Fill rate is a means to revenue per session, not an end in itself.
Publisher fill rate is the silent partner of CPM. It determines how much of your inventory is actually monetized. Ignoring fill rate while chasing higher CPM is like focusing on the price of a product while ignoring how many units you are selling. Both numbers matter, and effective RPM is the only metric that gives you the full picture.
The publishers who optimize fill rate see revenue gains that require no additional traffic. They close the gap between what they could earn and what they actually earn. They protect themselves from volatility and build a more resilient monetization foundation.
Adstork helps publishers improve fill rates by connecting them to multiple premium demand sources through a single integration. Our platform provides transparent reporting that shows you fill rate by country, device, and format, so you can identify and close your fill rate gaps. Sign up for a free Adstork publisher account and get a complimentary fill rate audit that shows you exactly where you are leaving revenue on the table.
Your immediate action plan: Pull your last 30 days of reporting and calculate your fill rate. If it is below 80%, investigate why. Segment it by country, device, format, and placement. Identify your lowest-performing segment. Test adding a complementary demand partner or adjusting your floor prices in that segment. Measure the impact on effective RPM, not just CPM. Share your results or reach out to Adstork's optimization team for a personalized fill rate improvement plan.
FAQs
What is publisher fill rate? Publisher fill rate is the percentage of ad requests that successfully display an ad. It is calculated as (Ad Impressions ÷ Ad Requests) × 100. Think of it as your conversion rate for ad inventory—every empty ad slot is a missed opportunity.
What is a good fill rate for publishers? A good fill rate is typically between 80% and 90%. Top-performing publishers achieve 90%+ and earn 5.3x more revenue per session than those below 40%. Header bidding setups typically achieve 85-95% fill rates.
Why does fill rate matter more than CPM? Fill rate and CPM work together to determine your actual revenue. A high CPM with low fill often earns less than a moderate CPM with high fill. Publishers who optimize for CPM while letting fill rate erode are often trading more total revenue for a more flattering per-impression number.
How can I improve my publisher fill rate? Diversify your demand sources with header bidding, calibrate floor prices strategically, improve viewability above 70%, use multiple ad formats, optimize technical performance, create passback tags, and monitor fill rate weekly.
What causes low fill rate? Low fill rate can be caused by limited demand sources, overly aggressive floor prices, geographic traffic mix, device mismatches, unsupported ad formats, technical issues, or traffic quality concerns.
Can I have a 100% fill rate? A 100% fill rate is theoretically ideal but practically unattainable. In programmatic advertising, some requests will always go unfilled due to floor price minimums, brand safety filters, geo restrictions, or low-demand inventory.


Leave a Comment