- 24 Aug, 2026
The Highest CPM Doesn't Always Win: What Publishers Should Actually Optimize
Your dashboard shows a $10 CPM. You feel good. The number is impressive. Your colleagues are impressed. You are winning.
Then you look at your actual revenue. It is not matching the excitement.
What happened? You were optimizing the wrong number.
CPM is the advertiser's metric. It tells you what they agree to pay. But what you actually earn is a different story entirely. A high CPM with low fill, low viewability, and poor engagement will almost always underperform a moderate CPM with strong fundamentals.
This is the trap that catches publishers every day. They chase the dashboard's prettiest number while ignoring the revenue outcome. This guide explains why the highest CPM doesn't always win, what you should actually optimize, and how to build a monetization strategy that prioritizes revenue, not vanity.
Key Takeaways:
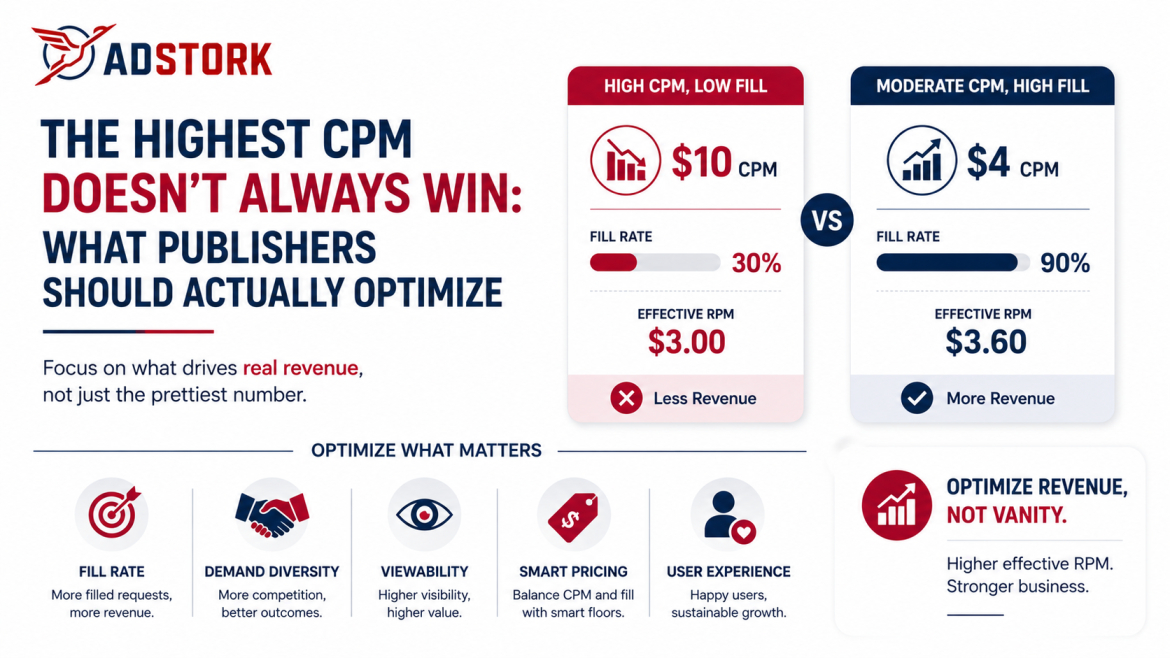
• The highest CPM doesn't always win a $10 CPM at 30% fill earns less than a $4 CPM at 90% fill.
• CPM is an advertiser metric. Effective RPM is a publisher metric. They are not the same.
• Optimize for revenue per 1,000 requests (effective RPM), not the dashboard's prettiest number.
• Fill rate, viewability, demand diversity, and user experience all affect your actual earnings more than headline CPM.
• Publishers who optimize for revenue outcomes consistently outperform those who chase vanity metrics.
The High CPM Trap
Here is the math that every publisher should internalize:
Publisher A: $10 CPM, 30% fill rate = $3.00 effective RPM
Publisher B: $4 CPM, 90% fill rate = $3.60 effective RPM
Publisher B has the lower headline CPM but earns more revenue. The $10 CPM looks better. But it is a lie.
Now add revenue share. If your network takes 30%, Publisher A's net effective RPM drops to $2.10. Publisher B's drops to $2.52. The gap widens.
Add viewability. If Publisher A's ads are 40% viewable and Publisher B's are 80% viewable, the real value gap grows even larger. Advertisers pay premiums for viewable inventory, and unviewable impressions generate less demand over time.
The high CPM trap is seductive because it appeals to our ego. We want to show the big number. We want to feel successful. But the big number often comes at the expense of fill rate, demand diversity, and long-term revenue stability.
Neuromarketing insight: the human brain fixates on the highest visible number. This is salience bias, we focus on what stands out, not what matters. CPM stands out because it is a single, impressive number. Effective RPM requires mental math. Publishers who overcome this bias and track the right metrics consistently outperform those who chase headlines.
What to Optimize Instead of CPM
If CPM is the wrong number to optimize, what should you focus on? The answer is effective RPM (revenue per 1,000 requests). But effective RPM is not a single lever. It is the outcome of several interconnected factors.
1. Fill rate. The percentage of ad requests that actually receive an ad. This is the most direct lever for increasing revenue. A 10% increase in fill rate is a 10% increase in revenue, assuming all else stays equal. Fill rate is often easier to improve than CPM, add demand partners, adjust floors, and optimize technical performance.
2. Demand diversity. The number and quality of demand sources competing for your inventory. More competition drives higher CPMs and better fill rates. Header bidding with multiple SSPs consistently outperforms single-source setups. Publishers using 3-5 demand partners see 20-40% revenue lifts compared to single-source configurations.
3. Viewability. The percentage of impressions that are actually seen by users. Viewable inventory commands higher CPMs. Above 80% viewability, buyers stop differentiating on viewability scores and start differentiating on fill rate, inventory volume, and audience quality.
4. Floor pricing. Dynamic floor pricing that balances fill rate and CPM. Static floors often sacrifice fill for CPM. Dynamic floors adjusted via real-time yield data capture 15%+ RPM uplift without traffic growth.
5. User experience. The quality of your site experience affects everything. Slow pages reduce fill. Poor mobile experiences reduce demand. High ad density drives users away. Publishers who maintain clean, fast, user-friendly sites consistently earn higher effective RPMs.
The right approach is to optimize all of these factors together. Chasing a single number—even CPM—will always produce suboptimal results.
The Math of Effective RPM
Effective RPM is the only number that captures your actual earnings per 1,000 requests. It combines fill rate and CPM into a single, meaningful metric.
Effective RPM = CPM × Fill Rate
Here is how different publishers compare at the same traffic volume (1 million monthly requests):
| Publisher | CPM | Fill Rate | Effective RPM | Monthly Revenue |
|---|---|---|---|---|
| A | $10.00 | 30% | $3.00 | $3,000 |
| B | $6.00 | 70% | $4.20 | $4,200 |
| C | $4.00 | 90% | $3.60 | $3,600 |
| D | $2.50 | 95% | $2.38 | $2,375 |
Publisher B has the highest revenue, not the highest CPM. Publisher A has the highest CPM but the lowest revenue. This is the trap in action.
Effective RPM also makes it easy to compare across formats and demand partners. A display ad with a $5 CPM and 70% fill generates the same effective RPM as a native ad with a $7 CPM and 50% fill. Without effective RPM, you would compare the $5 and $7 numbers and miss the reality.
Industry Insight: The Data Speaks for Itself
The data tells a clear story. Publishers who optimize for effective RPM consistently outperform those who chase high CPMs.
Analysis across publisher sites shows that the top-performing publishers by revenue are rarely the ones with the highest headline CPMs. They are the ones with the best balance of fill rate, demand diversity, viewability, and user experience.
Publishers who added demand partners and improved fill rates saw revenue lifts of 20-40%, even when their average CPMs dropped slightly. Publishers who chased high CPMs at the expense of fill rates often saw total revenue decline.
The gap is widening. As programmatic auctions become more sophisticated, the value of diversified demand and high fill rates is increasing. Publishers who optimize for the right metrics will capture this value. Those who chase vanity metrics will fall behind.
A recent industry analysis found that publishers who use header bidding with 3-5 SSPs achieve 20-40% revenue uplifts compared to single-source configurations. The revenue uplift is driven by better fill rates and higher competitive pressure, not just headline CPM.
Optimizing for revenue outcome requires a unified view of your monetization performance. Adstork connects publishers to multiple premium demand sources through a single header bidding platform, driving real-time competition that improves fill rates and effective RPM simultaneously. Our reporting shows you the metrics that actually matter effective RPM, revenue per session, and fill rate by segment—so you can optimize for revenue, not vanity. Explore Adstork's publisher solutions and see how better optimization transforms your revenue.
Comparison Table: Vanity Metrics vs. Revenue Metrics
Understanding the difference between vanity metrics and revenue metrics is essential for making better monetization decisions.
| Metric Type | Example | What It Really Tells You | Why It's Misleading |
|---|---|---|---|
| Vanity Metric | High CPM | What an advertiser agrees to pay | Ignores fill rate, viewability, and demand diversity |
| Vanity Metric | Total Impressions | How many ads were served | Doesn't tell you if they were seen or valuable |
| Revenue Metric | Effective RPM | Actual revenue per 1,000 requests | Combines CPM and fill rate into one meaningful number |
| Revenue Metric | Revenue Per Session (RPS) | Revenue per actual user visit | Measures real monetization performance |
| Revenue Metric | Viewable RPM | Revenue per 1,000 viewable impressions | What advertisers actually value |
Future Outlook: The End of Vanity Metrics
The industry is moving decisively away from vanity metrics and toward outcome-based optimization. Several trends are accelerating this shift.
Privacy regulations are making audience targeting more complex. Publishers who rely on high CPMs from targeted inventory are vulnerable. Those who build diversified demand and high fill rates are more resilient.
AI and automation are making it easier to optimize for effective RPM. Machine learning models can balance fill rate and CPM in real time, finding the optimal floor price and demand routing for each impression.
Advertiser sophistication is increasing. Brands are demanding more transparency and better performance metrics. They are increasingly rewarding publishers who can demonstrate strong effective RPM and viewability.
Unified measurement is becoming the standard. Publishers are moving away from fragmented dashboards and toward unified platforms that show the complete picture—fill rate, CPM, effective RPM, and revenue per session, all in one place.
The publishers who embrace this shift will thrive. Those who cling to vanity metrics will struggle.
The highest CPM doesn't always win. It rarely does. The publishers who consistently earn the most revenue are not the ones with the highest headline numbers. They are the ones who optimize for the complete picture—fill rate, demand diversity, viewability, and user experience.
Stop chasing the dashboard's prettiest number. Start optimizing for revenue outcome. Effective RPM is the metric that matters. It is the number that tells you what you actually earn, not what you could earn if everything went perfectly.
Adstork helps publishers escape the high CPM trap. Our platform provides transparent reporting, multi-SSP demand, and optimization tools that let you focus on effective RPM, not vanity metrics. Sign up for a free Adstork publisher account and get a complimentary revenue audit that shows you exactly where your optimization opportunities are.
Your immediate action plan: Pull your last 30 days of reporting and calculate your effective RPM for each demand partner and ad unit. Compare it to your headline CPM. Identify where the gap is largest—is it fill rate, viewability, or something else? Focus on fixing that gap. Share your results with Adstork's optimization team for a personalised revenue growth plan.
Frequently Asked Questions
Why doesn't the highest CPM always win? Because CPM is only half the equation. A high CPM with low fill rate generates less revenue than a moderate CPM with high fill. Effective RPM—the combination of CPM and fill rate is the metric that actually matters.
What should publishers optimize instead of CPM? Optimize for effective RPM (revenue per 1,000 requests), fill rate, demand diversity, viewability, and user experience. These factors together determine your actual revenue outcome.
What is effective RPM? Effective RPM is calculated as CPM × Fill Rate. It shows your actual earnings per 1,000 ad requests, combining the price you receive with the percentage of inventory that actually fills.
How do I increase effective RPM? Improve fill rate by adding demand partners, adjust floor prices to balance fill and CPM, improve viewability, diversify ad formats, and optimize page speed and user experience. Each of these factors contributes to higher effective RPM.
What is the difference between CPM and eCPM? CPM is what an advertiser agrees to pay. eCPM is what a publisher actually earns after accounting for fill rate, revenue share, and other factors. eCPM is the more accurate measure of publisher revenue.
Why do publishers chase high CPMs if they don't always win? Because high CPMs are visible and ego-boosting. They appeal to salience bias the tendency to focus on the most noticeable number. Publishers who overcome this bias and focus on effective RPM consistently outperform those who chase vanity metrics.
Comments (0)
Latest Blog

Why Are Advertisers Bidding Less on Your Inventory?
24 Aug, 2026
What Is eCPM and Why Does It Matter?
20 Aug, 2026
Leave a Comment