- 24 Aug, 2026
Your Fill Rate Is 70%. So Where Did the Other 30% Go?
Your dashboard shows a 70% fill rate. You think that is good. After all, 70% is a passing grade in most things.
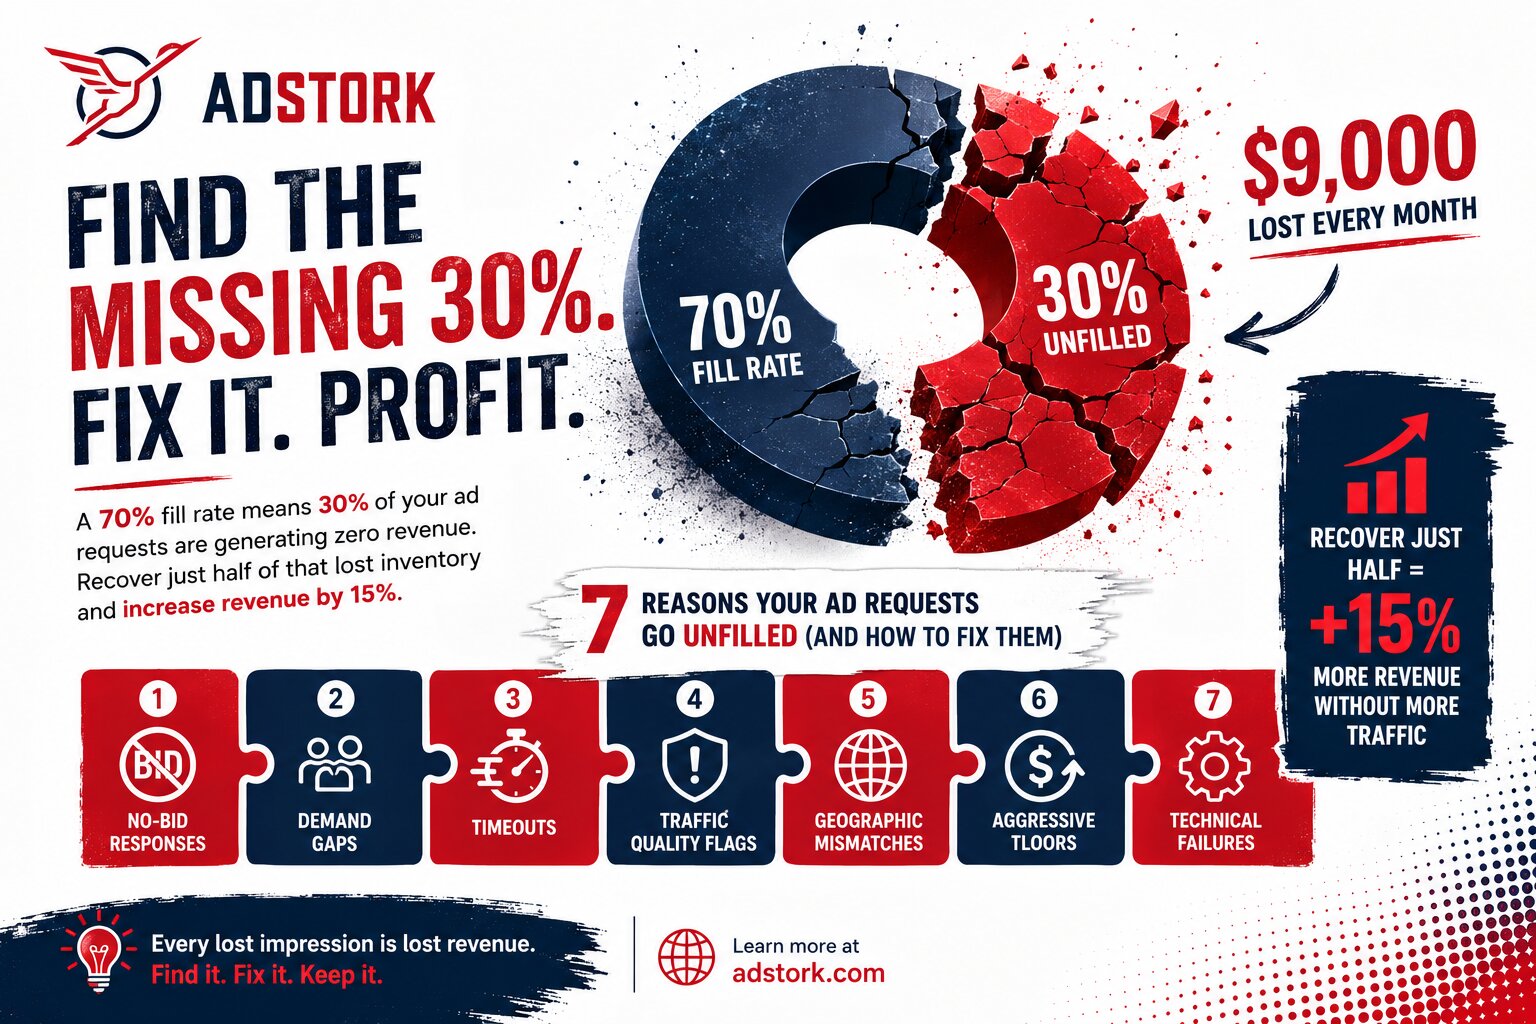
But here is the uncomfortable truth: 70% fill means 30% of your ad requests are generating zero revenue. On 10 million monthly requests at a $3 CPM, that is $9,000 in lost revenue every single month. Over a year, that is $108,000 disappearing into thin air.
The missing 30% did not just vanish. It is hiding in plain sight, scattered across seven common causes. Each one is identifiable. Each one is fixable. And recovering just half of that lost 30% can increase your revenue by 15% without a single additional visitor.
This guide shows you exactly where that missing 30% went—and how to get it back.
Key Takeaways
- A 70% fill rate means 30% of your ad requests are unfilled—recovering just half of that lost inventory increases revenue by 15%.
- The missing 30% comes from seven common causes: no-bid responses, demand gaps, timeouts, traffic quality flags, geographic mismatches, aggressive floors, and technical failures.
- Each cause has a specific fix: adding demand partners, adjusting floors, improving technical performance, or addressing traffic quality.
- No-bid responses are often the biggest contributor to unfilled requests.
- Understanding why your fill rate is 70% is the first step toward making it 85% or 90%.
The Anatomy of an Unfilled Ad Request
Every time a page loads on your site, your ad server sends a request to demand partners asking for an ad. In a perfect world, every request returns a bid and fills. But the world is not perfect.
An unfilled request is simply a request that did not result in an ad being served. The reasons fall into seven categories, each representing a different leak in your monetisation funnel.
Think of it like a retail store with empty shelves. The customers are there, the foot traffic is solid, but 30% of the shelves are bare. Why? Maybe the supplier is out of stock. Maybe the delivery is late. Maybe the price is too high. Maybe the shelves are hard to reach. The causes vary, but the outcome is the same: lost sales.
Neuromarketing insight: unfilled requests are invisible by nature. You see the filled impressions and the revenue they generate, but you do not see what you missed. The brain treats invisible losses differently than visible ones. This is loss aversion bias. Publishers who ignore unfilled requests are unconsciously accepting losses they would never tolerate if those losses were visible. Making the invisible visible is the first step to fixing it.
1. No-Bid Responses
This is the most common cause of unfilled requests. A demand partner receives your request, evaluates the impression, and decides not to bid.
Why does this happen? Sometimes the bidder does not have an active campaign that matches your audience. Sometimes the buyer has spent their budget for the day. Sometimes the impression does not meet their targeting criteria.
No-bid responses are a signal that your demand sources are not fully aligned with your inventory. If many partners are saying "no bid," you may need to diversify your demand stack or improve your audience appeal.
Fix: Add complementary demand partners. A publisher with one SSP might have no-bid rates of 30-40%. With three to five SSPs, no-bid rates often drop below 10% because more buyers are competing for each impression.
2. Demand Availability Gaps
Not all ad formats, devices, or geographies have equal demand. If you are running a format that few buyers support, fill rates will suffer.
For example, video ads typically have higher fill rates than rich media formats because more buyers support video. Native ad fill rates vary dramatically by network. Mobile web interstitials often have strong fill, but rewarded video can be more limited.
Demand availability gaps are also seasonal and cyclical. During major shopping periods like Q4, demand is abundant across most formats. During slower months, certain formats and geographies may see fill rates drop.
Fix: Diversify your formats. If your site relies heavily on a format with limited demand, test other formats. A mix of display, native, and video can smooth out demand gaps across formats.
3. Timeouts
Every ad request has a timeout window, typically 1-2 seconds. If a demand partner does not respond within that window, the request is considered unfilled.
Timeouts are a technical issue. They happen when the bidder's servers are slow, when network latency is high, or when the page is overloaded with too many simultaneous requests. Timeouts are more common on mobile devices, where latency is naturally higher.
Publishers using client-side header bidding with multiple partners often experience higher timeout rates because the browser is making many concurrent calls. Server-side header bidding reduces timeout rates by moving the auction to a server with better connectivity.
Fix: Migrate to server-side header bidding. Reduce the number of partners in your client-side setup. Optimise page load speed to give more time for ad requests. Adjust timeout settings based on your specific technical environment.
4. Traffic Quality Flags
Demand partners filter out traffic they consider low quality or suspicious. If your traffic is flagged, you will see a higher percentage of no-bid responses or filtered impressions.
Common red flags include high bounce rates, short session durations, suspicious referral sources, sudden traffic spikes, and geographic anomalies. Advertisers want to reach real humans with genuine engagement potential. Traffic that looks automated, incentivised, or low-intent gets less demand.
This creates a vicious cycle: low-quality traffic gets less demand, which reduces fill rate, which reduces revenue, which incentivises volume over quality, which creates more low-quality traffic.
Fix: Audit your traffic sources. Cut low-quality sources that trigger flags. Focus on building high-engagement audiences through quality content and legitimate acquisition channels. Clean traffic attracts better demand and higher fill rates.
5. Geographic Demand Mismatches
Advertiser demand varies dramatically by geography. Tier-1 countries like the US, UK, Canada, and Australia have abundant demand and high fill rates. Tier-2 and tier-3 countries often have limited demand and lower fill.
If your traffic is heavily concentrated in countries with low advertiser demand, your fill rate will reflect that. A publisher with 80% US traffic might see 85% fill. A publisher with 80% Indian traffic might see 50% fill.
The gap is not your fault, but it is your problem. Demand partners simply have fewer campaigns targeting those regions.
Fix: Add demand partners with stronger coverage in your geos. Some SSPs specialise in tier-2 and tier-3 markets. Test different partners to find the ones that fill your specific geos best. Accept that geography sets a ceiling on your fill rate and focus on optimising within that constraint.
6. Overly Aggressive Floor Prices
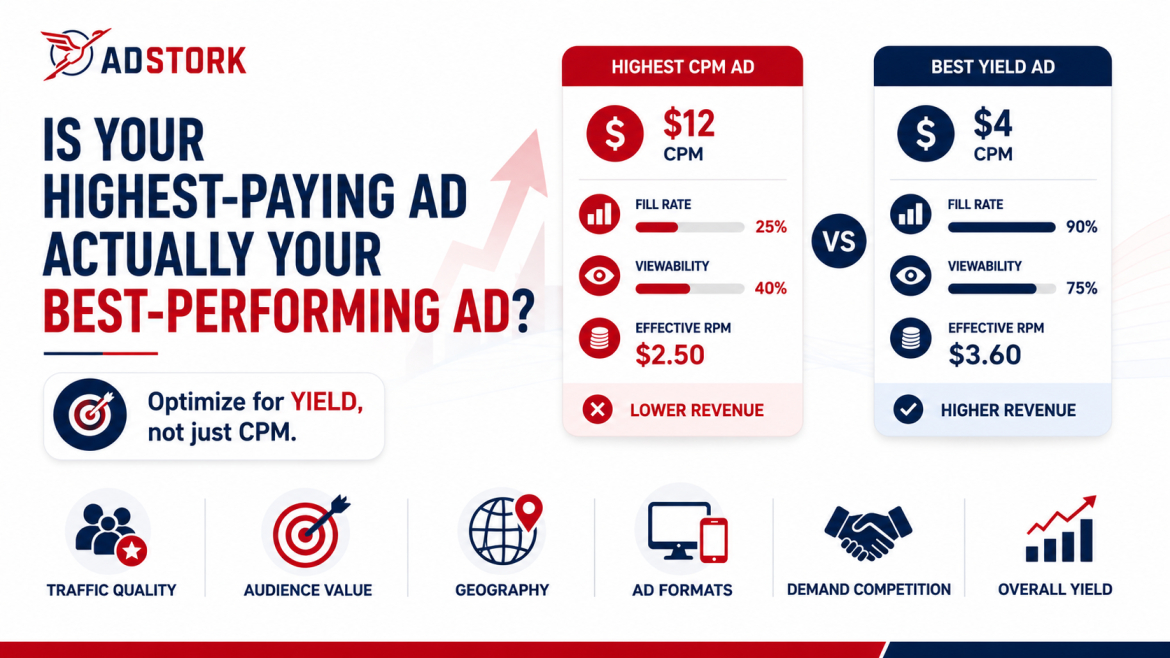
Floor prices protect you from low bids, but setting them too high can kill competition and reduce fill. If buyers typically bid around $1.50 and your floor is $2.50, you are rejecting demand that could have generated meaningful revenue.
Publishers with aggressive floors run at roughly half the fill rate of right-sized competitors. They charge nearly 2x the CPM per impression and still generate 18% less revenue per session.
This is the floor price trap. You chase higher CPMs, set floors too high, kill fill, and end up earning less overall.
Fix: Test floors systematically. Run controlled tests at different floor levels and measure total revenue, not just CPM. A slightly lower floor that fills 20% more inventory often produces higher overall earnings. Test floors by GEO, device, and format, not globally.
7. Technical Issues
Sometimes the problem is technical. The ad tag is misconfigured. The page is loading too slowly. The ad server is having trouble. The browser is blocking the request.
Technical issues are often invisible. You might see a filled impression in your dashboard that never actually rendered on the page. You might see a timeout error that you assume is normal.
Common technical issues include ad tag placement errors, JavaScript conflicts, slow page load times, mobile rendering problems, and ad blocker interference.
Fix: Audit your technical setup. Check ad tag placement, page speed, and mobile performance. Use ad verification tools to ensure ads are actually rendering. Optimise Core Web Vitals to reduce load times. Consider server-side header bidding to reduce browser-side failures.
Diagnosing where your 30% went requires a unified view of your monetisation performance. Adstork provides transparent, real-time reporting that breaks down unfilled requests by cause no-bid responses, timeouts, traffic quality flags, and more. You can see exactly which segment is underperforming and take targeted action. Explore Adstork's publisher reporting tools and start recovering your lost revenue today.
Industry Insight: What the 2026 Data Shows
The causes of unfilled requests are not equally distributed. Analysis across publisher sites reveals clear patterns.
No-bid responses are the largest contributor, accounting for 40-60% of unfilled requests. This is where adding demand partners has the biggest impact. Each additional SSP can reduce no-bid rates by 5-10%.
Timeouts account for 15-25% of unfilled requests, especially on mobile devices and in slower geographies. Server-side header bidding can reduce timeout rates by 50-70%.
Traffic quality flags affect 10-20% of requests on sites with mixed traffic sources. Clean traffic sources see flag rates below 5%.
Geographic mismatches determine the baseline fill rate. Publishers in tier-1 geos often start with 80%+ fill, while tier-2/3 publishers start at 40-60%.
The takeaway is clear: you need to know your specific breakdown before you can fix it. A publisher with mostly no-bid responses needs demand diversity. A publisher with mostly timeouts needs technical optimisation. A publisher with traffic quality flags needs cleaner sources.
Comparison Table: Fill Rate Causes and Solutions
Here is a quick reference guide to the seven causes of unfilled requests and how to fix them.
| Cause | Typical Impact | Solution |
|---|---|---|
| No-Bid Responses | 40-60% of unfilled | Add complementary demand partners |
| Demand Gaps | 10-20% of unfilled | Diversify formats, add format-specific partners |
| Timeouts | 15-25% of unfilled | Server-side header bidding, faster page loads |
| Traffic Quality Flags | 10-20% of unfilled | Audit and clean traffic sources |
| Geographic Mismatches | 5-15% of unfilled | Partners with better regional coverage |
| Aggressive Floors | 5-10% of unfilled | Test floors, measure total revenue |
| Technical Issues | 5-10% of unfilled | Audit setup, optimise Core Web Vitals |
Future Outlook: Closing the Fill Rate Gap
The future of fill rate optimisation is about intelligence and automation. Publishers who rely on manual diagnosis will fall behind those who use data-driven tools.
AI-powered diagnosis is emerging as a key tool. Machine learning models can analyse unfilled requests and identify patterns faster than humans can. They can tell you that your no-bid rate spikes at 2 PM every Tuesday, or that timeouts are 3x higher on mobile devices in Southeast Asia.
Automated floor optimisation is reducing the floor price trap. Dynamic floors adjust in real time based on fill rate and CPM, finding the balance that maximises total revenue.
Unified demand management is replacing the fragmented approach. Instead of managing multiple SSPs separately, publishers are using unified wrappers that route traffic intelligently to maximise fill and revenue.
The gap between 70% and 85% fill is significant. It is the difference between stable revenue and revenue that consistently leaves money on the table. Publishers who understand where their 30% went and take action to recover it will build more sustainable businesses.
Your fill rate is 70%. That is not a passing grade. It is a signal that 30% of your revenue potential is leaking away.
The missing 30% is hiding in no-bid responses, demand gaps, timeouts, traffic quality flags, geographic mismatches, aggressive floors, and technical issues. Each cause is identifiable. Each is fixable. And recovering just half of that lost 30% can increase your revenue by 15% without a single additional visitor.
Adstork helps publishers diagnose and fix fill rate issues with transparent reporting, multi-SSP demand, and optimisation tools. Our platform shows you exactly where your unfilled requests are going and provides the infrastructure to close those gaps. Sign up for a free Adstork publisher account and get a complimentary fill rate diagnosis that shows you exactly where your 30% is going and how to get it back.
Your immediate action plan: Pull your last 30 days of reporting and segment unfilled requests by cause. Identify your biggest contributor, is it no-bid responses, timeouts, traffic quality, or something else? Focus on fixing that one cause first. Test one solution like adding a demand partner or adjusting floors and measure the impact over two weeks. Share your results with Adstork's optimisation team for a personalised improvement plan.
FAQs
Why is my fill rate 70% and not higher? A 70% fill rate means 30% of your ad requests are unfilled. The most common causes are no-bid responses (when demand partners choose not to bid), timeouts (when requests take too long), traffic quality flags, geographic demand mismatches, aggressive floor prices, and technical issues.
What is a no-bid response? A no-bid response occurs when a demand partner receives your ad request but decides not to submit a bid. This can happen if they do not have an active campaign matching your audience, if they have spent their budget, or if the impression does not meet their targeting criteria.
How do timeouts affect fill rate? Timeouts happen when a demand partner does not respond within the allowed time window, typically 1-2 seconds. This is more common with client-side header bidding and on mobile devices. Timeouts can be reduced by migrating to server-side header bidding.
Can aggressive floor prices reduce fill rate? Yes. Setting floor prices too high can kill competition and reduce fill. If buyers typically bid around $1.50 and your floor is $2.50, you are rejecting demand. Test floors at different levels and measure total revenue, not just CPM.
How does geography affect fill rate? Advertiser demand varies by geography. Tier-1 countries like the US, UK, and Canada have high demand and high fill rates. Tier-2 and tier-3 countries have lower demand and lower fill rates. This creates a baseline fill rate that is difficult to exceed without regional demand partners.
What is a good fill rate to aim for? Top-performing publishers achieve 85-95% fill rates using header bidding with multiple demand partners. Most well-optimised publishers land between 80% and 90%. Below 80% means you are likely leaving significant revenue on the table.


Leave a Comment