- 13 Aug, 2026
Why Is My Website Ad Revenue So Low? 10 Problems Publishers Should Check
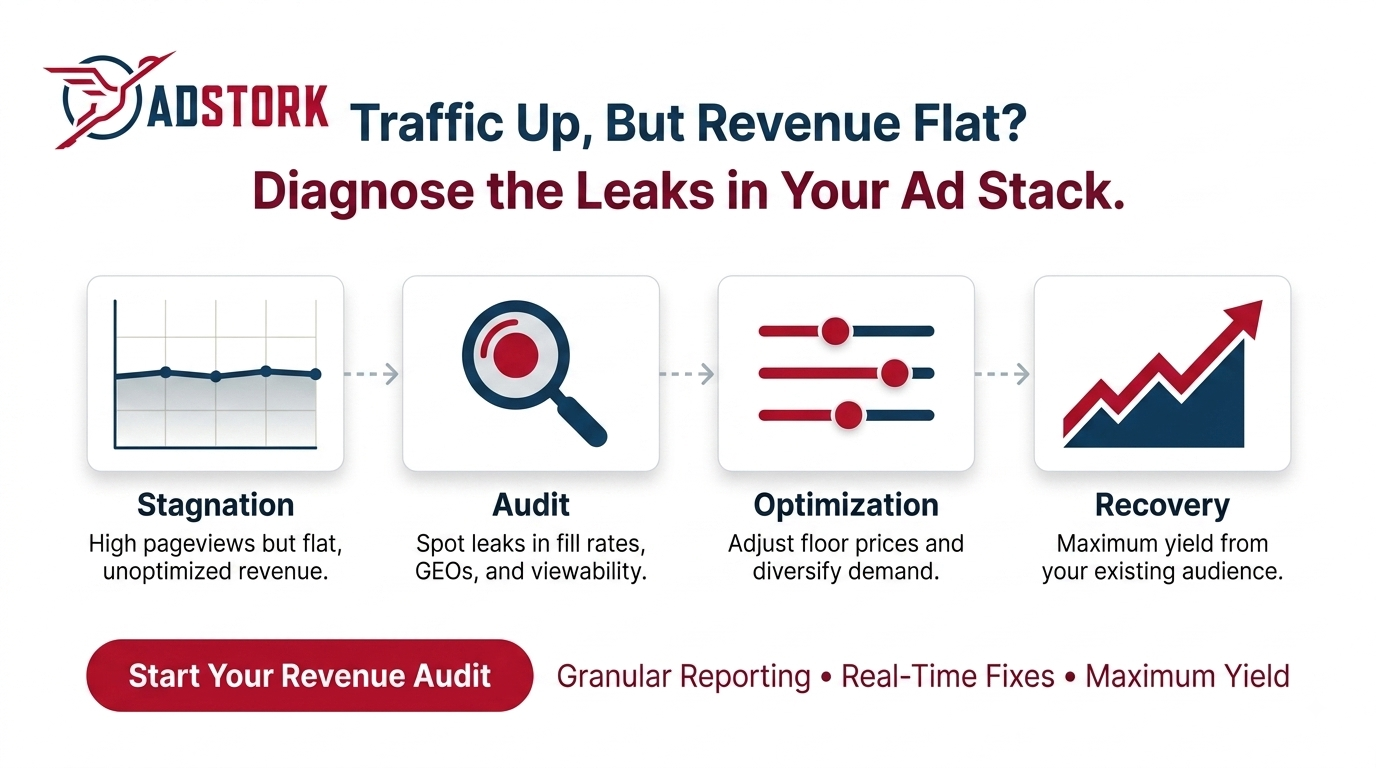
Your traffic is climbing. Your page views are up. So why is your revenue line staying flat?
Before you spend another dollar on user acquisition, look inward at your existing inventory. The revenue you are missing is probably already sitting in your ad stack, hidden behind low fill rates, weak demand, poor placements, or a mismatched monetisation setup. This post walks through the ten most common revenue killers we see across publisher sites, with actionable checks you can run today.
Key Takeaways
- More traffic does not automatically mean more ad revenue; inventory quality and demand matter equally.
- Fill rate and CPM must be evaluated together; chasing the highest CPM often sacrifices total revenue.
- Geography, device, format, and traffic quality directly affect advertiser demand and bidding.
- Poor viewability reduces the effective value of your impressions even if they load.
- The right monetisation partner helps you diagnose these issues rather than just serving tags.
1. Your Fill Rate Is Too Low
You may have plenty of ad slots, but not every request receives a bid. Fill rate is filled requests divided by total requests. If you have 1M requests and only 600K fill, you leave 400K opportunities unmonetised. Low fill often comes from limited demand, high floors, unsupported formats, or weak GEOs. Break your fill rate down by country, device, and placement to spot the biggest gaps.
2. Your CPM Is Low, but That Is Not the Full Story
Chasing the highest CPM without considering fill rate is a classic trap. Network A at 90% fill and $1.50 CPM often beats Network B at 30% fill and $4.00 CPM in total revenue. Always calculate effective revenue per 1,000 requests, not per filled impression. This gives you the real picture.
3. Your Traffic Comes From Low-Demand GEOs
Advertiser demand and pricing vary dramatically by region. 500K impressions from a low‑demand country may earn less than 150K from a premium GEO. Segment your reporting by country and look at impressions, fill, CPM, and revenue side by side. You will often find a small geographic slice contributes most of your income.
4. Your Ads Have Poor Viewability
An ad can load but never be meaningfully seen. Banners placed far below the fold may generate impressions, but users rarely scroll that far. Review placements above versus below the fold, desktop versus mobile, and on different page types. Advertisers pay premiums for viewable inventory, so moving placements higher can lift CPMs.
5. You Are Using the Wrong Ad Format
Different audiences respond to different formats. A news site may perform best with native ads, while a gaming site may unlock higher CPMs through video or interstitials. Test formats that fit your content, device mix, and user behaviour. More ad units do not equal more revenue; the right format in the right context wins.
6. Your Floor Price Is Too Aggressive
Floor prices protect you from low bids, but setting them too high kills competition. If buyers bid $1.00‑$1.50 and your floor is $2.50, you reject demand that could have generated revenue. Test floors granularly by GEO, device, and placement, and measure total revenue, not just the winning CPM. A slightly lower floor that fills 20% more inventory often earns more overall.
7. Traffic Quality Is Suppressing Advertiser Demand
Advertisers want real humans with genuine engagement. Suspicious referral sources, bot activity, or sudden geographic spikes can cause demand partners to reduce bidding or filter your inventory. Monitor traffic sources, referral URLs, and engagement metrics. Clean, verified traffic commands a consistent premium in programmatic auctions.
8. Your Ads Are Loading Too Slowly
Ads compete with your content for loading resources. Slow ad requests, rendering delays, or timeouts reduce delivered impressions and hurt user experience. Monitor ad request latency, creative load time, and timeout rates, especially on mobile. Faster ads are more likely to be seen and clicked.
9. You Are Looking Only at Total Revenue
If revenue drops 20%, the headline number tells you nothing. Break performance down by country, then device, then format, then placement, and finally demand partner. This drill‑down reveals exactly which segment is dragging you down. Without segmentation, you will waste time fixing parts that are not broken.
10. You Are Relying on Only One Demand Partner
One monetisation partner can work, but relying on a single source caps your potential. A second or third demand source introduces competition and benchmarking, especially if your current partner has weak GEO fill, limited format coverage, or declining CPMs. But adding partners blindly creates complexity. Look for complementary networks, not duplicates.
Diagnosing these ten problems requires a dashboard that shows fill, CPM, viewability, and revenue segmented by every dimension. Adstork provides real‑time, granular reporting that isolates underperforming segments in seconds. You can see exactly which GEO, device, or format is dragging your RPM down and make data‑driven adjustments on the fly. Explore Adstork's publisher reporting tools and see how transparent analytics change the way you optimise.
Industry Insight: What the Data Shows
Analysis across 300+ publisher sites shows that geographic/device mismatches cause nearly 45% of revenue loss. Viewability issues reduce effective RPM by an average of 30%. And publishers adding a complementary secondary network saw fill rates improve by 12‑18% and overall revenue increase by 15‑22% without changing traffic volume. These are the low‑hanging fruit.
Comparison Table: Healthy vs. Struggling Publisher
Benchmark your performance against these typical metrics for the same traffic volume.
| Metric | Healthy Publisher | Struggling Publisher |
|---|---|---|
| Fill Rate (Overall) | 85 – 95% | 50 – 70% |
| Effective CPM (Tier 1) | $2.50 – $5.00 | $0.80 – $1.80 |
| Viewability Rate | 65 – 80% | 30 – 50% |
| Geographic Revenue Split | Balanced across 3‑5 tier‑1 GEOs | Heavily reliant on one low‑value GEO |
| Demand Partners | 2‑3 complementary sources | 1 single source |
| Revenue per 1,000 Sessions | $8 – $15 | $2 – $5 |
Conclusion: Fix What You Have Before Chasing More
If your website ad revenue is lower than expected, do not assume you need more traffic. Check the fundamentals: fill rate, CPM, GEO split, viewability, format fit, floor pricing, traffic quality, speed, segmentation, and demand diversity. Once you know where the problem is, you can fix it systematically.
If your current monetisation setup is not delivering the demand, transparency, or support you need, it may be time to evaluate another partner. Adstork offers a unified platform with visibility into every one of these ten metrics, plus dedicated support to help you diagnose and resolve each leak. Start your free Adstork publisher trial and get a complimentary revenue audit that pinpoints exactly which problem is costing you the most.
Your immediate action plan: Pull your last 30 days of reporting and segment by country. Identify your three lowest‑performing GEOs and check their fill rates and CPMs. Then run a floor price test on one of those GEOs for one week. Compare total revenue, not just CPM. Share your results or reach out to Adstork's optimisation team for a personalised walkthrough.
Frequently Asked Questions
Why is my website ad revenue so low despite high traffic? High traffic does not guarantee high revenue. Low fill rates, weak CPMs, poor viewability, low‑demand GEOs, traffic quality issues, and inefficient ad placements can all reduce monetisation regardless of volume.
How can I increase my website ad revenue? Start by analysing fill rate, CPM, GEO, device, format, viewability, and demand partners. Identify the weakest area and test improvements. Focus on revenue per session, not just impressions.
Does more website traffic always mean more ad revenue? No. A smaller but higher‑value audience can generate more revenue than a larger low‑value audience with poor fill and low CPMs.
Should publishers use multiple ad networks? Yes, when additional demand improves fill or revenue. Two to three complementary sources is a practical sweet spot for most mid‑tier publishers.
Does ad placement affect revenue? Yes. Placement affects viewability and the perceived value of impressions. Poorly positioned ads may generate impressions but contribute little to revenue.
Keep reading:
• Popunder Ads vs. Interstitial Ads: Which Pays More for Publishers?
• Programmatic Advertising 2026: What Publishers Must Know Now
• The Best Ad Placement Strategies for High‑CPM Niches




Leave a Comment